鼠标追踪技术学习笔记
Introduction to mouse tracking
- Using mouse cursor tracking to investigate online cognition:
Mouse cursor tracking has become a prominent method for characterizing cognitive processes, used in a wide variety of domains of psychological science.鼠标跟踪已经成为表征认知过程的重要方法,被广泛应用于心理科学的各个领域。
This survey reveals that there is room for improvement in reporting practices, especially of subtler design features that researchers may have assumed would not impact research results
这项调查显示,报告实践中还有改进的空间,特别是研究人员可能认为不会影响研究结果的微妙设计特征
Response time is the dominant measure of this cognitive processing. However, response times provide but a single constraint on the cognitive operations that happen between the stimulus and the response. Just more than 15 years ago, researchers began to employ mouse cursor tracking to investigate whether ongoing action was influenced by concurrent cognition.反应时间是衡量这种认知过程的主要指标。然而,反应时间仅对发生在刺激和反应之间的认知操作提供单一约束。仅仅在15年前,研究人员就开始使用鼠标光标追踪来研究正在进行的行为是否受到同时认知的影响。
Because action was relatively continuously tracked during cognition, researchers surmised that features of ongoing action (e.g., deflection toward alternative responses) might provide further constraints on candidate sets of cognitive operations.由于在认知过程中相对连续地跟踪动作,研究人员推测正在进行的动作的特征(例如,偏向替代反应)可能对候选的认知操作集提供进一步的限制。
This early period of mouse-tracking research has been characterized by impressive methodological ingenuity and has generated novel insights in a variety of cognitive subdomains. A downside of such ingenuity is, however, a lack of agreed standards that may inhibit the accumulation of knowledge.这一早期的鼠标追踪研究以令人印象深刻的方法论独创性为特征,并在各种认知子领域产生了新的见解。然而,这种独创性的一个缺点是缺乏公认的标准,这可能会阻碍知识的积累。
The current paper reviews the methodological degrees of freedom in mouse-tracking experiments and illustrates a path toward standards for mouse-tracking paradigms.当前的论文回顾了鼠标跟踪实验中的方法论自由度,并说明了实现鼠标跟踪范式标准的途径。
[常用的几种过程追踪的方法]Process-tracing methods have a long tradition in psychological science. In order to understand cognition, researchers have employed introspective self-report measures such as verbal protocols (e.g., Ericson & Simon, 1984), as well as more objective behavioral or psychophysiological measures, such as eye-tracking (e.g., Russo & Rosen, 1975) or neuroimaging (e.g., Figner et al., 2010; for a comprehensive overview, please see Schulte-Mecklenbeck, Johnson, et al., 2017).
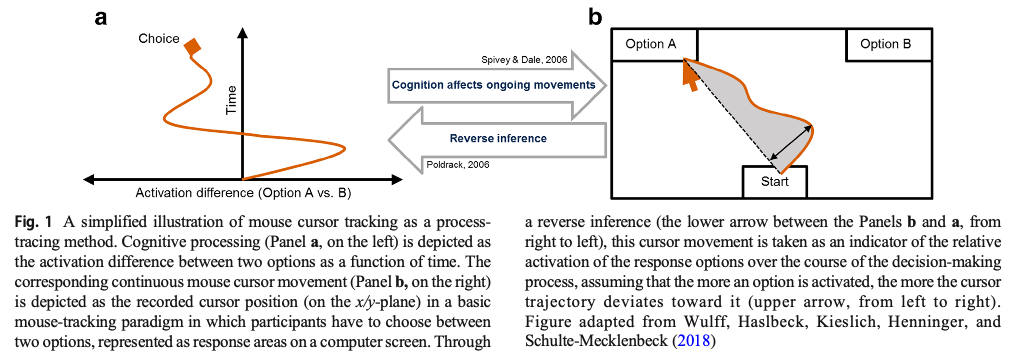
The canonical mouse-tracking paradigm involves a binary forced-choice task in which participants respond to an imperative stimulus by deciding between two options represented as buttons on a computer screen while their cursor movements are continuously recorded (see Fig. 1b for the basic setup and an exemplary cursor trajectory). These cursor movements are taken as an indicator of the relative activation of response options over the course of cognitive processing, assuming that the more an option is activated, the more the cursor trajectory deviates toward it (Spivey, Grosjean, & Knoblich, 2005).典型的鼠标跟踪范式涉及一个二元强制选择任务,参与者通过在计算机屏幕上表示为按钮的两个选项之间做出决定,同时连续记录他们的光标移动(参见图 1b 了解基本设置和示例性光标轨迹)。这些光标移动被视为在认知处理过程中响应选项的相对激活的指标,假设选项被激活的越多,光标轨迹偏离它的程度就越大。
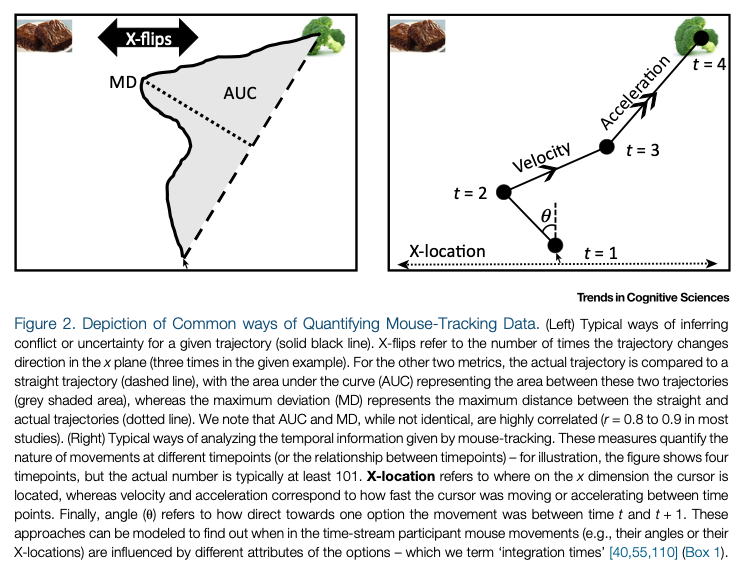
More complex indicators have been used as well to infer properties of cognitive processes, such as the entropy of movements or the number of zero-crossings on the x-axis indicating conflict in the decision process (Calcagnì, Lombardi, & Sulpizio, 2017; Kieslich, Henninger, Wulff, Haslbeck, & Schulte-Mecklenbeck, 2019).
For mousecursor tracking, the reverse inference is based on the assumption that cognitive processing affects ongoing motor activation/responses (e.g., hand movements) and hence cursor movements (Spivey & Dale, 2006), as depicted by two the unidirectional arrows in Fig. 1.对于鼠标光标跟踪,反向推理基于认知处理影响正在进行的运动激活/反应(例如,手部运动)并因此影响光标运动(Spivey & Dale,2006)的假设,如图 1 中的两个单向箭头所示.
In the past 15 years, mouse cursor tracking has been applied in many domains of psychological science (Erb, 2018; Freeman, 2018; Song & Nakayama, 2009; Stillman et al., 2018).
With our review, we briefly summarized the history of mousetracking research, highlighting its impressive methodological ingenuity.
A successful accumulation of knowledge in psychological science builds on valid inferences from observed measures onto cognitive processes. However, valid inferences do not come naturally; they crucially depend on methodological rigor as well as critical scrutinizing of the applied auxiliary assumptions.心理科学知识的成功积累建立在从观察到的测量对认知过程的有效推论上。然而,有效的推论并不是自然而然的。它们主要取决于方法的严谨性以及对所应用的辅助假设的严格审查。
Sternberg (1969) scrutinized Donders’ (1868) subtraction method and developed his own additive-factor method, and hence substantially enhanced the measure of response time as a window into cognitive processing.
Mouse cursor tracking is exquisitely sensitive to a range of design features and to enhance the potential of this method to explore cognition, we need to be clear about the implications of our design choices. Even though there may be preferred designs for specific phenomena, experimental designs should not only target the comparability between studies but also consider the validity of each single study. Hence, instead of one gold standard, different options should be available to researchers, though combined with the knowledge about the implications of each choice and with complete reporting to ensure that future research can reproduce and build on existing work.鼠标光标跟踪对一系列设计特征非常敏感,为了增强这种方法探索认知的潜力,我们需要清楚我们的设计选择的含义。尽管可能存在针对特定现象的首选设计,但实验设计不仅应针对研究之间的可比性,而且还应考虑每项研究的有效性。因此,研究人员应该使用不同的选择,而不是一个黄金标准,尽管结合每个选择的影响的知识和完整的报告,以确保未来的研究可以复制和建立在现有工作的基础上。
How Mouse-tracking Can Advance Social Cognitive Theory鼠标追踪如何推进社会认知理论
Mouse-tracking – measuring computer-mouse movements made by participants while they choose between response options – is an emerging tool that offers an accessible, data-rich, and real-time window into how people categorize and make decisions.鼠标追踪是一种新兴工具,通过测量参与者在选择响应选项时做出的计算机鼠标移动,它提供了一个可访问的、数据丰富的、实时的窗口,用于了解人们如何分类和做出决策。In the present article we review recent research in social cognition that uses mouse-tracking to test models and advance theory. In particular, mouse-tracking allows examination of nuanced predictions about both the nature of conflict (e.g., its antecedents and consequences) as well as how this conflict is resolved (e.g., how decisions evolve).在本文中,我们回顾了最近使用鼠标跟踪来测试模型和推进理论的社会认知研究。特别是,鼠标跟踪允许检查关于冲突性质(例如,其前因和后果)以及这种冲突如何解决(例如,决策如何演变)的细微预测。
We demonstrate how mouse-tracking can further our theoretical understanding by highlighting research in two domains - social categorization and self-control. We conclude with future directions and a discussion of the limitations of mouse-tracking as a method.我们通过突出社会分类和自我控制两个领域的研究来展示鼠标追踪如何进一步加深我们的理论理解。我们总结了未来的方向,并讨论了鼠标跟踪作为一种方法的局限性。
Highlights
Computer-mouse movements reflect underlying cognitive processes, and, by continuously measuring mouse movements while participants make a judgment ordecision (i.e., mouse-tracking), researchers can get a real-time window into how such choices evolve.计算机鼠标运动反映了潜在的认知过程,并且通过在参与者做出判断或决定时不断测量鼠标运动,研究人员可以获得有关此类选择如何演变的实时窗口。
Mouse-tracking has the potential to offer a sensitive measure of the conflict present between two response options, allowing researchers to test theoretical predictions about the antecedents and consequences of decisional conflict.鼠标跟踪有可能对两种反应选项之间存在的冲突提供一种敏感的衡量方法,使研究人员能够测试关于决策冲突的前因和后果的理论预测。
The rich temporal data offered by mousetracking allows testing of nuanced theories regarding how decisions evolve, and allow researchers to make specific predictions about the time-course of the evolution of a decision.鼠标追踪提供的丰富的时间数据允许测试关于决策如何演变的细微理论,并允许研究人员对决策演变的时间过程做出具体预测。
Recent research in social cognition most notably in social categorization and self-control literatures – has begun to use mouse-tracking to predict and understand judgments and decisions that are complex and consequential.最近在社会认知方面的研究,尤其是在社会分类和自我控制方面的文献中——已经开始使用鼠标追踪来预测和理解复杂和后果性的判断和决定。
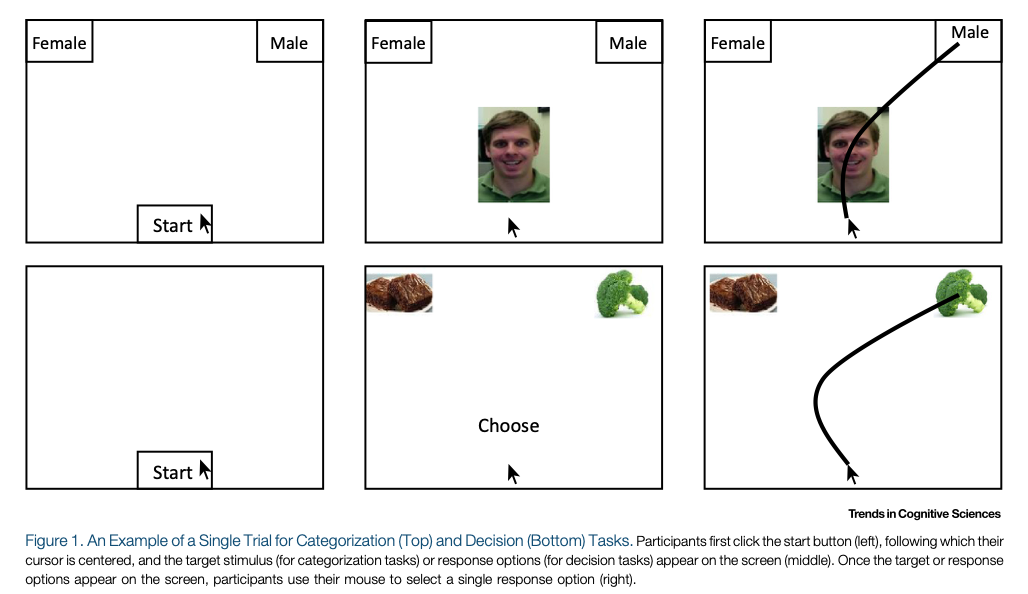
常见鼠标追踪范式示意图
- Using mouse cursor tracking to investigate online cognition
Kieslich et al. (2020) investigated the influence of the start procedure, the response procedure, and the cursor speed setting in a semantic categorization task (R. Dale et al., 2007). Across all methodological setups, they replicated the postulated cognitive effect (category typicality effect), but revealed that the size of this effect was significantly influenced by the type of response and start procedure.
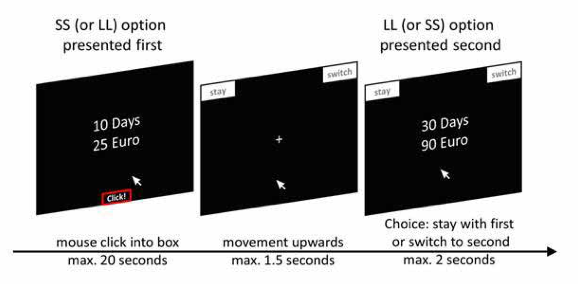
Schoemann, Lüken, and colleagues (2019) investigated the influence of the start procedure, the response procedure, and the location of the stimuli in a mouse-tracking version of intertemporal choice task (Dshemuchadse, Scherbaum, & Goschke, 2013). They found that the variation of start procedure (i.e., static) perturbed the postulated cognitive effect; across the other methodological setups, they found no systematic variation of the cognitive effect.
- Stillman, P. E., Shen, X., & Ferguson, M. J. (2018). How Mouse-tracking Can Advance Social Cognitive Theory. Trends in Cognitive Sciences, 22(6), 531–543. https://doi.org/10.1016/j.tics.2018.03.012
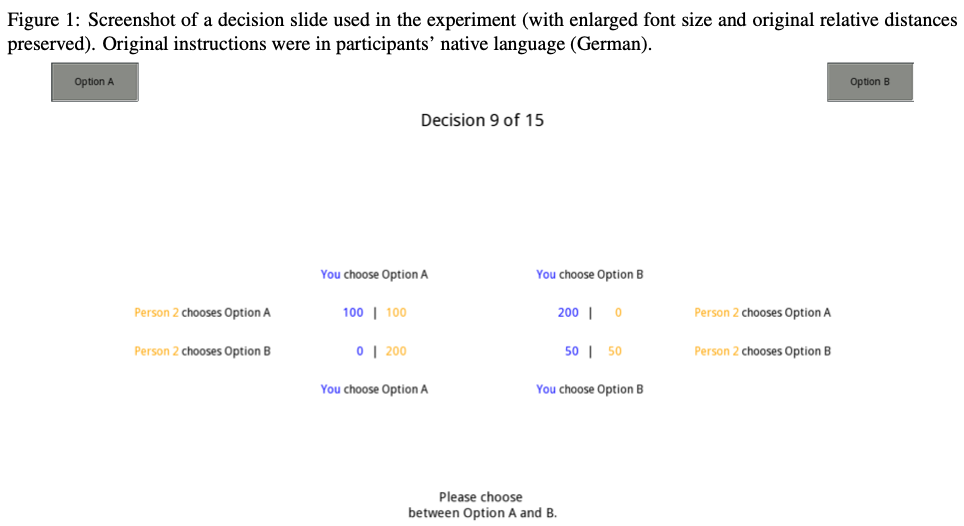
Kieslich, P. J., & Hilbig, B. E. (2014). Cognitive conflict in social dilemmas: An analysis of response dynamics. Judgment and Decision Making, 9(6), 13.
Stillman, P. E., Krajbich, I., & Ferguson, M. J. (2020). Using dynamic monitoring of choices to predict and understand risk preferences. Proceedings of the National Academy of Sciences. https://doi.org/10.1073/pnas.2010056117
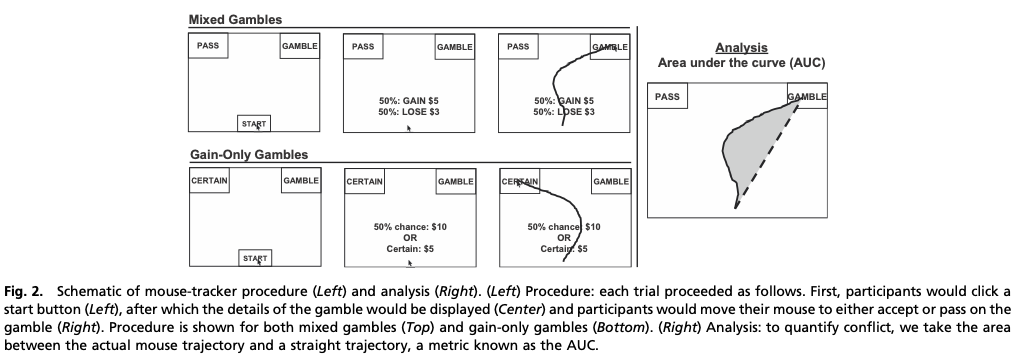
Georgii, C., Schulte-Mecklenbeck, M., Richard, A., Van Dyck, Z., & Blechert, J. (2020). The dynamics of self-control: Within-participant modeling of binary food choices and underlying decision processes as a function of restrained eating. Psychological Research, 84(7), 1777–1788. https://doi.org/10.1007/s00426-019-01185-3

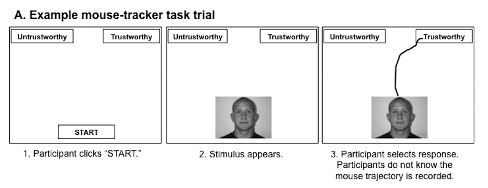
- Cassidy, B. S., Boucher, K. L., Lanie, S. T., & Krendl, A. C. (2019). Age Effects on Trustworthiness Activation and Trust Biases in Face Perception. The Journals of Gerontology: Series B, 74(1), 87–92. https://doi.org/10.1093/geronb/gby062
- Scherbaum, S., Frisch, S., & Dshemuchadse, M. (2018). Step by step: Harvesting the dynamics of delay discounting decisions. Quarterly Journal of Experimental Psychology, 71(4), 949–964. https://doi.org/10.1080/17470218.2017.1307863
鼠标追踪记录技术的细节
The experiment was conducted full screen with a resolution of 1,680 × 1,050 pixels. Laboratory computers were running Windows 7, and mouse settings were left at their default values (acceleration turned on, medium speed). Cursor coordinates were recorded every 10 ms.
The experiment was conducted as the second part in a series of unrelated studies. Before the experiment, we assessed participants’ handedness using the Edinburgh Handedness Inventory (EHI; Oldfield, 1971). We used a modified version of the EHI with a five-point rating scale on which participants indicated which hand they preferred to use for ten activities (-100 = exclusively left, −50 = preferably left, 0 = no preference, 50 = preferably right, 100 = exclusively right) and included an additional item for computer mouse usage. 「测试被试是否为右利手」

Minimal reporting standards
Here, we present a first draft of minimal reporting standards for mouse cursor tracking (inspired by Fiedler et al., 2019).
Method
Description of the mouse-tracking device
Model (e.g., M110 Silent) [Computer mouse model]
Producer/brand (e.g., Logitech) [Computer mouse producer]
Type (e.g., laser or optical with 1000 dpi and 125 Hz, wireless-2.4GHz-connection) [Computer mouse sensor technology including resolution and sampling rate, Computer mouse connection technology]
Surface (e.g., mousepad) [Computer mouse surface]
Description of the monitor
Model (e.g., BenQ Senseye 3) [Monitor model]
Producer (e.g., BenQ) [Monitor producer]
Resolution [Screen resolution]
Size [Screen size]
Description of the Software
Software settings for the computer mouse and the resulting hand/cursor movement ratio (e.g., cursor speed, acceleration) [Cursor settings]
Software used to record the mouse-tracking data [Software record]
Stimulus presentation software [Software present]
Material
Absolute size of start box and its content [Start box size]
Absolute size of response boxes and its contents [Response boxes size]
Absolute distance between response boxes [Response box distance]
Absolute distance between response boxes and start box [Start box distance]
Absolute size of stimulus [Stimulus size]
Procedure
Hand used (and handedness of participants) [Handedness]
Practicing trials [Training]
Procedure-related feedback [Feedback]
Awareness of participants [Awareness]
Procedure of trial start [Start procedure incl. Movement initiation
deadline]
Procedure of response indication [Response procedure incl. Response
deadline]
Duration of stimulus presentation [Stimulus duration]
Counter balancing of response boxes [Response box mapping]
Location of response boxes [Response box position]
Location of start box [Start box position]
Location of stimulus [Stimulus position]
Number of trials [Trials]
Settings and locations where data was collected [Location]
Results
Data quality
Proportion of trials excluded for the analysis [Exclusion trial]
Reasons for exclusion [Exclusion reason]
Number of participants excluded from the analysis [Exclusion
participants]
Quality threshold for data exclusion [Exclusion quality]
Sampling rate of the data [Sampling rate]
Dependent measures
Normalization method for data [Normalization]
Indexation method for discrete measures [Indexation]
Additional transformation of the data [Transformation]
鼠标追踪数据分析
The libraries required for the following analyses can be installed from CRAN using the following command: install.packages(c(“readbulk”,“mousetrap”)).
OpenSesame produces an individual comma-separated (CSV) data file for each participant. Because there is a single logger item in the experiment that is repeated with each trial, every line corresponds to a trial.
For our purposes, the most important columns are those containing the mouse-tracking data, namely the columns beginning with timestamps, xpos, and ypos. These columns contain the interval since the start of the experiment in milliseconds, and the x and y coordinates of the cursor at each of these time points. The position coordinates are given in pixels, whereby the value 0 for both x and y coordinates corresponds to the center of the screen and values increase as the mouse moves toward the bottom right.
As a first step after opening R (or RStudio), the current working directory should be changed to the location where the raw data is stored (either using setwd or via the user interface in RStudio). To read the data of all participants into R, we suggest the readbulk R package (Kieslich & Henninger, 2016), which can read and combine data from multiple CSV files into a single dataset. Readbulk provides a specialized function for OpenSesame data (read_opensesame). Assuming that the raw data is stored in the subfolder “raw_data” of the working directory, we can combine all individual files into a single data.frame using read_opensesame(“raw_data”).
For preprocessing and analyzing mouse-tracking data, we have developed the mousetrap R package (Kieslich et al., 2016).
Trajectories are remapped using mt_remap_symmetric which ensures that every trajectory starts at the bottom of the coordinate system and ends in the top left corner (regardless of whether the left or the right response option was chosen).
关于鼠标位置数据使用单位的问题
I’m trying to make sure that there’s everything I need in the .csv output so I have a few questions:
- I see in my experiments settings that the units are “height” by default, which I understand are relative to the window. Am I right that any x coordinate will then be relative to the center of each participant’s window? Or is it relative to where the mouse start at the beginning of the routine?
- Are height units what people usually use or do you have recommendations for other units? It’s my first time with mouse-tracking so I’m not really sure what’s best here. I only care about whether and when they will start clicking the left or right polygon.
- Should I also collect coordinates relative to the polygons? It’s been suggested to me by a colleague but I’m not sure how and why.
Finally, do you know if there is anyway that coordinates as well as time stamps for every frame would show up in the output in long format rather than as a long list of values per trial?
Mouse coordinates are relative to the centre of the screen.
Height coordinates work best since they scale but maintain aspect the ratio. I sometimes use norm for instructions.
However, I would recommend that you use the contains method for polygons, not coordinates.
可能需要自己显示器的高宽比
At the moment, my solution is to set the size as (0.69,1) as the aspect ratio of the stimulus is 3:4.
[Units for the window and stimuli]https://www.psychopy.org/general/units.html
Hello!
I have a stupid question:
If I set the text stimuli size on PsychoPy (to be used on Pavlovia) height= 0.08, how can I report that in a paper (usually the pixel size or font size is reported)?
Pixels (in terms of units) are easy to calculate, just 0.08/2 * your screen height in pixels. But again, that doesn’t tell you much about the size of the actual letters, which depends on the font chosen and the specific glyphs displayed. If you want an accurate measurement of glyph size in actual pixels, then the best approach is to take a screenshot and measure some given letters.
鼠标追踪技术展望
With mousetrap, we hope to make mouse-tracking accessible to researchers from many different fields, and thereby to enable them to gain insights into the dynamics of cognitive processes. Given the fast-paced development of the mousetracking method, we hope that our modular and open approach will help users to implement the increasingly complex designs, to combine mouse-tracking with other process tracing methods such as eye-tracking, and to apply the method in fields where only few mouse-tracking studies have been conducted so far, such as behavioral economics with real-time interactive experiments. Similarly, we hope that the open data format and the close link to open analysis tools such as those demonstrated herein will make the manifold methods of analyzing mouse-tracking data widely available. 使用鼠标追踪,我们希望让来自许多不同领域的研究人员能够进行鼠标跟踪,从而使他们能够深入了解认知过程的动态。鉴于鼠标跟踪方法的快速发展,我们希望我们的模块化和开放式方法将帮助用户实现日益复杂的设计,将鼠标跟踪与其他过程跟踪方法(如眼动跟踪)结合起来,并应用该方法在迄今为止只进行了很少的鼠标跟踪研究的领域中,例如具有实时交互实验的行为经济学。同样,我们希望开放数据格式和开放分析工具的紧密链接,例如本文展示的那些,将使分析鼠标跟踪数据的多种方法广泛可用。